HealthFlow Friction Analysis
HealthFlow (Healthcare SaaS)
Dec 2025
Interactive visualization tool transforming UX research findings into explorable user journey maps. Built to communicate friction points more effectively than static reports.
Company: HealthFlow (Healthcare SaaS)
Date: Dec 2025
Tech: Next.js, TypeScript, React, shadcn/ui, Tailwind CSS, D3.js, Vercel
Roles: Learning Experience Engineer, Frontend Developer, UX Researcher
Highlights: Next.js 14 App Router with TypeScript, shadcn/ui component system, Interactive journey flow visualization, 5-part framework: Context → Expectation → Reality → Impact → Opportunity, Color-coded friction levels (low/medium/high), Deployed on Vercel
Methods: Systematic observation framework, User journey mapping, Interactive data visualization, Component-driven development, Rapid prototyping with v0.dev
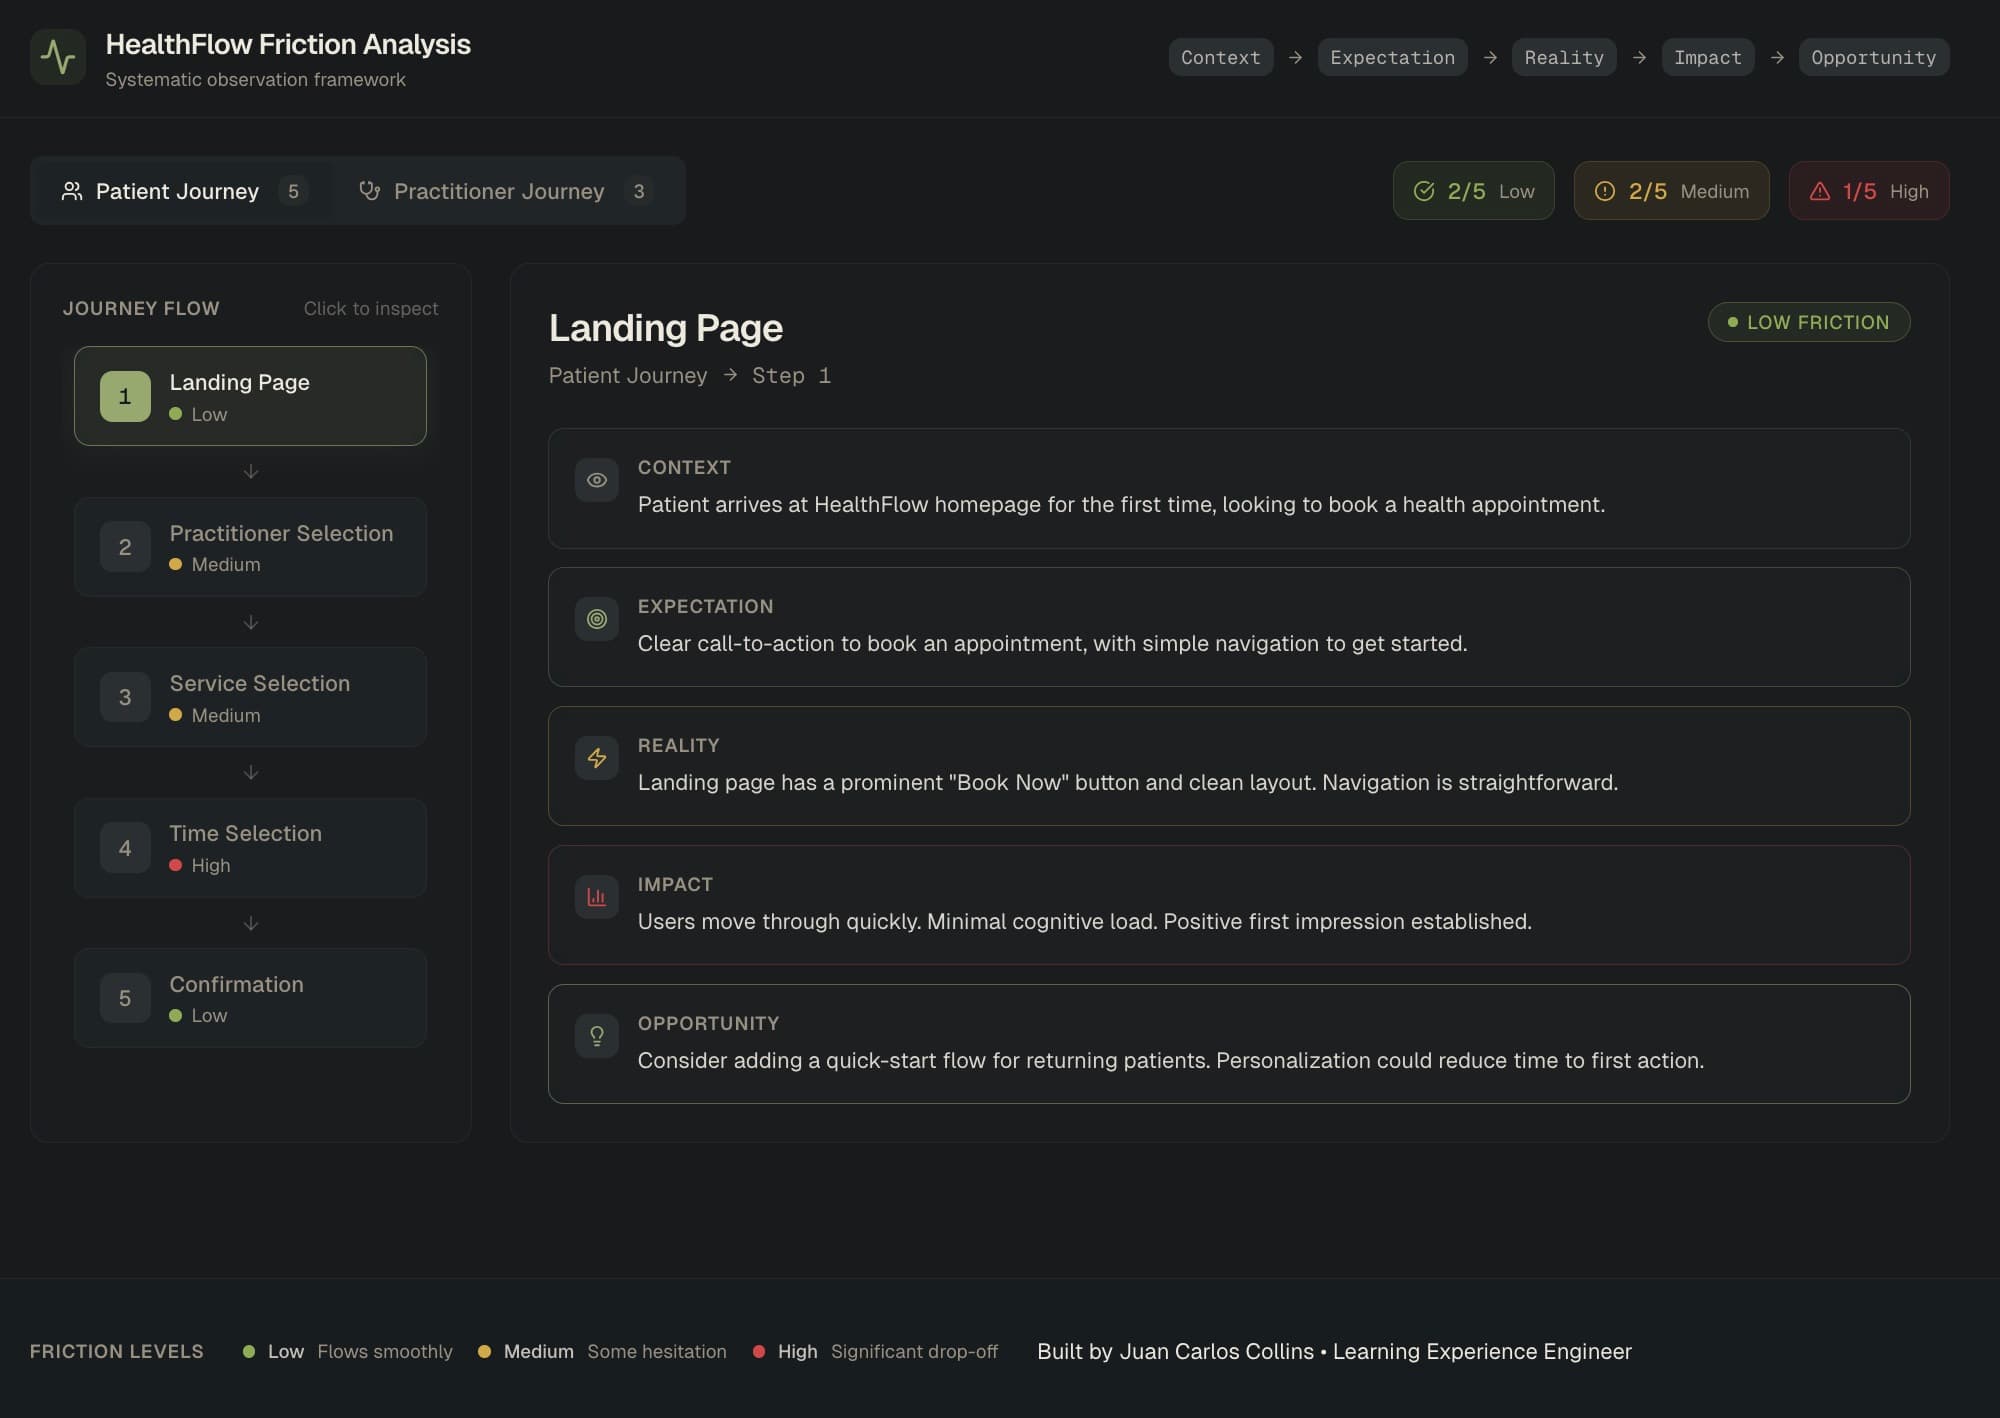
Interactive Journey Visualization
Built an interactive dashboard that transforms static UX research reports into explorable journey maps. Product teams can click through patient and practitioner onboarding steps, seeing friction analysis at each stage. Color-coded indicators provide at-a-glance understanding of friction severity.
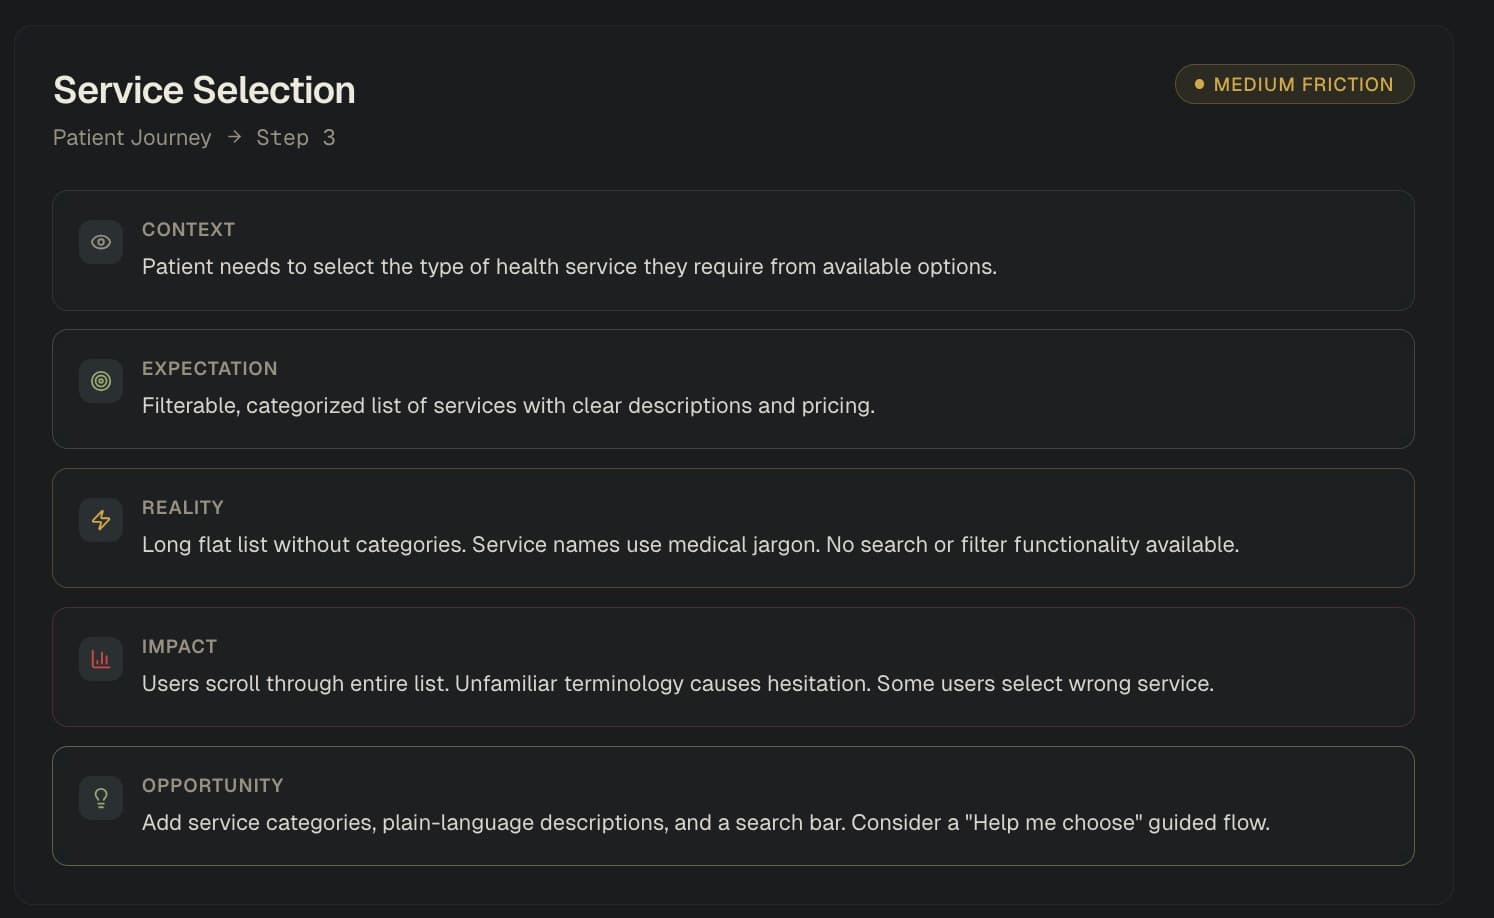
5-Part Observation Framework
Developed a systematic research methodology capturing Context (what's happening), Expectation (what users expect), Reality (what actually happens), Impact (effect on users/business), and Opportunity (how to improve). Each journey step displays this framework in an organized panel, making complex findings digestible.
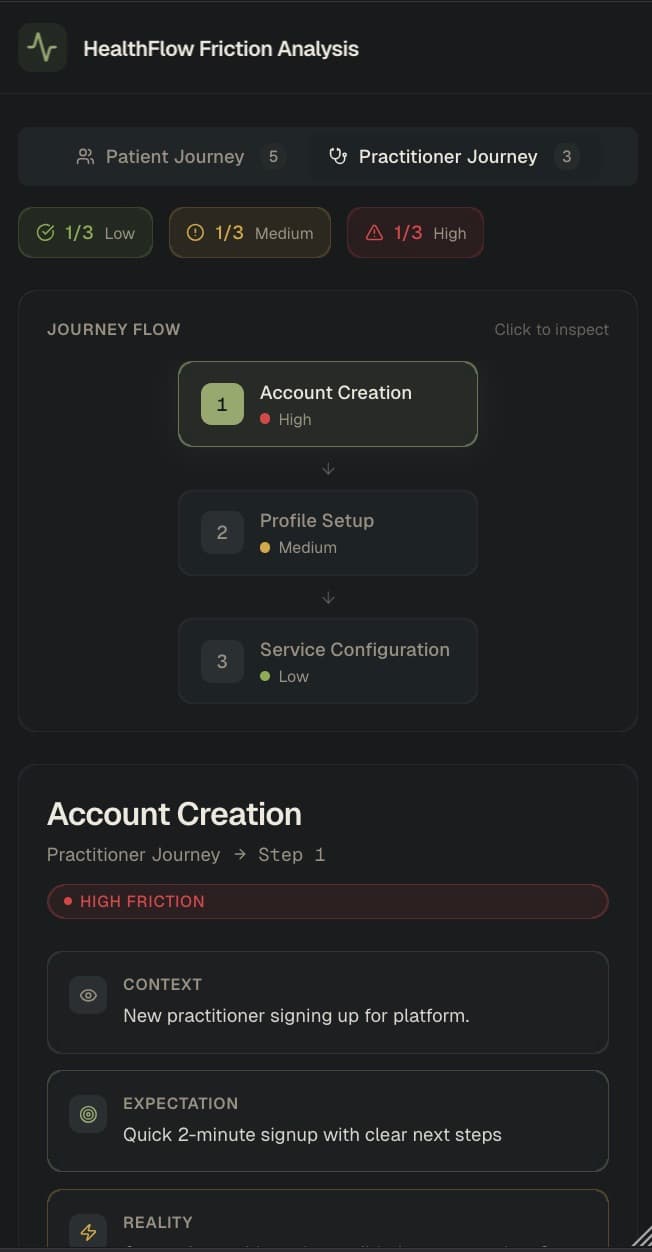
Modern Tech Stack & Responsive Design
Built with Next.js 14, TypeScript, and shadcn/ui components. Features elegant dark mode design with custom color palette optimized for extended viewing. Fully responsive across desktop, tablet, and mobile devices. Deployed on Vercel with automatic CI/CD.